Create powerful, interactive visualisations using business intelligence with Microsoft Power BI.
INTRODUCING MICROSOFT POWER BI
The business world is increasingly data driven. Small and large businesses alike use data to make decisions about sales, hiring, goals, and all areas for which they have data. While most businesses have access to data of one type or another, it can be intimidating to try to understand without a background in data analytics or statistics. Even if you do understand the data, a challenge may arise in displaying the data in an easy to understand way and communicating it to other relevant people.
Power BI takes the intimidation and hassle out of data analysis and visualization. By connecting to one or more of the hundreds of existing data sources and using a secure, easy to understand interface, you can quickly and simply interact with and understand your data to influence all business systems.
Power BI is a collection of software services, apps, and connectors that work together to turn your unrelated sources of data into coherent, visually immersive, and interactive insights. Your data may be an Excel spreadsheet, or a collection of cloud-based and on-premises hybrid data warehouses. Power BI supports large range of data sources. It allows you to connect to different flat files, SQL, DB2, Oracle, SAP, Azure cloud and many web platforms such as Facebook, Google Analytics, and Salesforce objects.
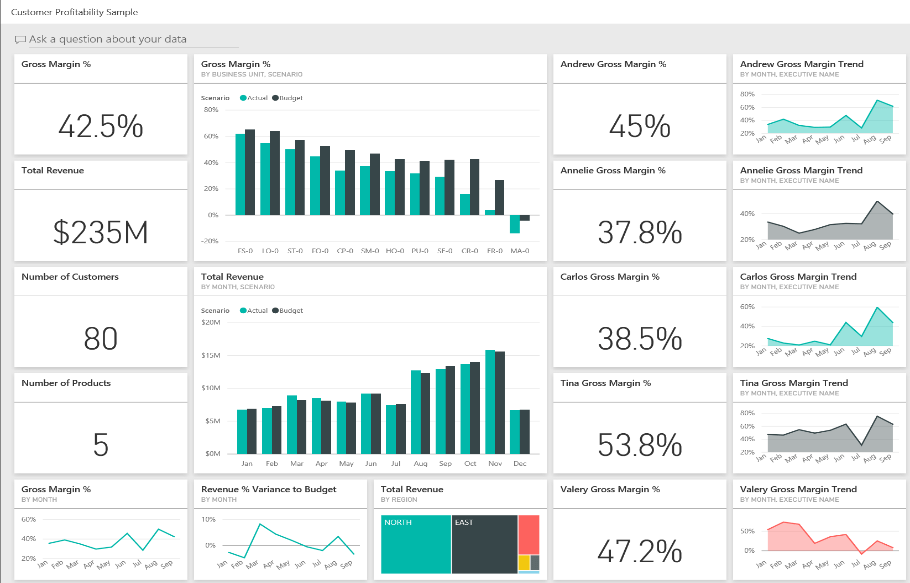
Power BI lets you easily connect to your data sources, visualise and discover what’s important, and then share your reports online with anyone you choose:
OUR MICROSOFT POWER BI COURSES
Our Microsoft Power BI training courses are designed to teach participants how to create highly interactive and sophisticated dashboards using Power BI.
WOULD YOU LIKE TO FIND OUT MORE ABOUT MICROSOFT POWER BI?
To find out more about our Microsoft Power BI courses, please email us at: sales@olas.ie.
Author: Stephen Cox, Training Consultant.